US Molded Fiber Tableware Imports by Country (2025-2026)
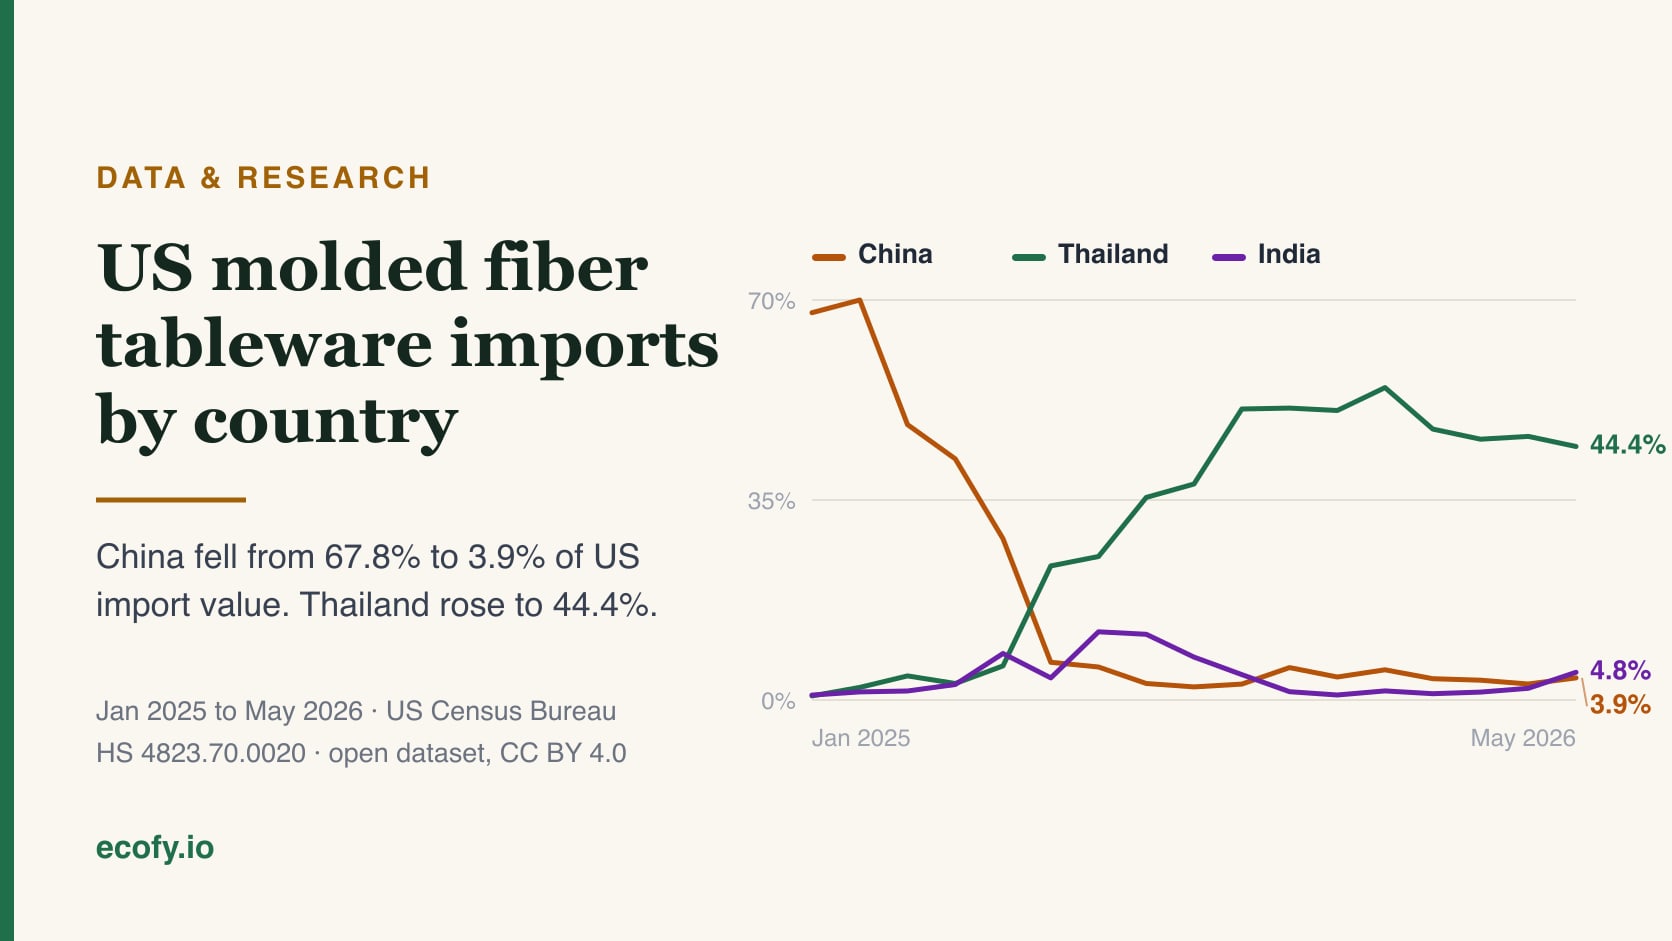
Monthly US import data for molded fiber plates, bowls and cups by origin. China fell 67.8% to 3.9%, Thailand rose to 44.4%. US Census figures, open dataset.
On this page
Sourcing in bulk?
Tell us your products and quantity
We supply distributors and brands in 30+ countries, and reply with pricing, lead time and shipping.
Key finding: US imports of molded fiber tableware fell 45 percent between January 2025 and July 2026, from 23.1 to 12.8 million dollars a month. Over that period China’s share collapsed from 67.8 percent to 4.3 percent, having reached 3.9 percent in May 2026, while Thailand rose from 0.7 percent to 56.9 percent. India’s share rose from 0.9 percent to 5.8 percent, and India was the fourth largest origin by July 2026. Buyers weighing that shift can see what an eco friendly tableware manufacturer in India supplies and at what scale. For what the tariff line actually covers, see how molded fiber is made and classified.
3.9%
China's share
was 67.8% in Jan 2025
44.4%
Thailand's share
was 0.7% in Jan 2025
4.8%
India's share
was 0.9%, 7th largest origin
−41%
Total US imports
$23.1m to $13.6m a month
The monthly data
The table below gives US molded fiber tableware import data by origin for every month from January 2025 to May 2026, as a share of that month’s total import value. Ten origins are shown individually; every remaining country is grouped into “Other”.
| Month | Total | China | Thailand | Vietnam | Taiwan | Malaysia | Cambodia | Dom. Rep. | Indonesia | India | Other |
|---|---|---|---|---|---|---|---|---|---|---|---|
| Jan 2025 | $23.1m | 67.8% | 0.7% | 11.1% | 4.1% | 0.5% | 9.4% | 3.9% | 0.0% | 0.9% | 1.7% |
| Feb 2025 | $18.5m | 70.0% | 2.2% | 9.7% | 6.7% | 0.4% | 2.4% | 5.7% | 0.0% | 1.4% | 1.5% |
| Mar 2025 | $15.6m | 48.2% | 4.2% | 16.1% | 12.8% | 1.3% | 5.5% | 7.3% | 0.0% | 1.6% | 3.0% |
| Apr 2025 | $13.1m | 42.2% | 2.9% | 18.3% | 19.8% | 2.7% | 5.2% | 5.0% | 0.0% | 2.7% | 1.3% |
| May 2025 | $8.3m | 28.2% | 6.0% | 19.2% | 18.7% | 4.7% | 4.4% | 6.7% | 0.1% | 8.1% | 3.9% |
| Jun 2025 | $9.5m | 6.6% | 23.5% | 13.0% | 19.0% | 11.6% | 9.6% | 6.0% | 0.0% | 3.9% | 6.8% |
| Jul 2025 | $11.8m | 5.8% | 25.1% | 11.2% | 15.2% | 12.0% | 8.4% | 5.6% | 0.0% | 11.9% | 4.8% |
| Aug 2025 | $16.0m | 2.9% | 35.5% | 19.2% | 11.3% | 8.3% | 5.3% | 3.7% | 0.0% | 11.5% | 2.4% |
| Sep 2025 | $11.8m | 2.3% | 37.8% | 17.6% | 15.7% | 8.5% | 1.3% | 5.6% | 0.0% | 7.5% | 3.7% |
| Oct 2025 | $11.9m | 2.8% | 50.9% | 10.8% | 13.6% | 9.2% | 1.8% | 4.1% | 0.0% | 4.4% | 2.4% |
| Nov 2025 | $13.2m | 5.7% | 51.1% | 8.1% | 13.2% | 12.8% | 2.0% | 4.4% | 0.0% | 1.5% | 1.4% |
| Dec 2025 | $14.5m | 4.0% | 50.7% | 14.0% | 9.3% | 11.8% | 1.1% | 4.3% | 0.0% | 0.9% | 3.9% |
| Jan 2026 | $15.8m | 5.3% | 54.7% | 12.4% | 6.7% | 11.1% | 0.0% | 3.4% | 2.0% | 1.6% | 2.9% |
| Feb 2026 | $12.0m | 3.7% | 47.4% | 14.2% | 7.8% | 10.8% | 0.2% | 5.8% | 3.2% | 1.1% | 5.8% |
| Mar 2026 | $15.7m | 3.5% | 45.6% | 9.4% | 9.0% | 11.5% | 0.0% | 4.5% | 11.5% | 1.4% | 3.6% |
| Apr 2026 | $13.4m | 2.8% | 46.1% | 10.3% | 9.7% | 11.8% | 0.7% | 4.9% | 6.2% | 2.0% | 5.5% |
| May 2026 | $13.6m | 3.9% | 44.4% | 10.6% | 8.2% | 5.4% | 1.0% | 6.2% | 10.5% | 4.8% | 5.1% |
| Jun 2026 | $13.9m | 1.9% | 42.2% | 11.5% | 7.7% | 7.5% | 1.2% | 6.1% | 15.5% | 3.5% | 3.1% |
| Jul 2026 | $12.8m | 4.3% | 56.9% | 7.4% | 4.7% | 6.3% | 1.1% | 4.7% | 3.4% | 5.8% | 5.4% |
Shares are of each month’s total, so every row sums to 100 percent. “Other” covers all remaining origins, none of which exceeded 4 percent in any single month. The largest of them is Mexico, which reached 3.8 percent in February 2026. The antidumping and countervailing duty orders took legal effect on 27 January 2026.
How much does the US import?
US imports of molded fiber tableware totalled 13.6 million dollars in May 2026, against 23.1 million dollars in January 2025. That is a fall of 41 percent between those two months.
The decline is not a single event. Monthly values dropped to 8.3 million dollars by May 2025, recovered to 16.0 million dollars in August 2025, and have since ranged between 11.8 and 16.0 million dollars.
Which countries supply the US?
Thailand supplied 56.9 percent of US molded fiber tableware imports in July 2026, making it the largest origin by a wide margin and its highest share in the series. Vietnam followed at 7.4 percent, Malaysia at 6.3 percent, India at 5.8 percent, the Dominican Republic and Taiwan at 4.7 percent each, China at 4.3 percent and Indonesia at 3.4 percent. In May 2026, the last month covered before this update, Thailand stood at 44.4 percent, Vietnam at 10.6 percent, Indonesia at 10.5 percent, Taiwan at 8.2 percent, the Dominican Republic at 6.2 percent, Malaysia at 5.4 percent and India at 4.8 percent.
China, which supplied more than two thirds of the market at the start of 2025, held 3.9 percent, ranking eighth.
Largest origins by total value
Across the full 17 months, ranked by total value, the largest origins were Thailand at 71.3 million dollars, China at 50.4 million, Vietnam at 30.9 million, Taiwan at 26.1 million, Malaysia at 17.6 million and the Dominican Republic at 11.9 million. India was seventh at 8.6 million dollars.
How did China’s share change?
China’s share of US molded fiber tableware imports fell from 67.8 percent in January 2025 to 3.9 percent in May 2026.
The decline was concentrated in a four month window. China held 70.0 percent in February 2025, then 48.2 percent in March, 42.2 percent in April, 28.2 percent in May and 6.6 percent by June. It has not exceeded 5.8 percent in any month since.
That window closed roughly seven months before the duty orders took legal effect on 27 January 2026. Preliminary determinations precede the final orders and carry provisional duties. Commerce published its preliminary countervailing duty determination on 14 March 2025 and its preliminary antidumping determination on 12 May 2025, so provisional exposure existed from the spring of 2025 rather than from the following January.
Two cautions before reading that as cause. These are arrival figures, so the goods counted in any month were produced and shipped weeks earlier and cannot respond to a notice published inside that month. And the same months carried a broad escalation of US tariffs on Chinese goods, which this series cannot separate from the molded fiber proceeding. What the data supports is that the decline was complete long before the orders took effect, not that the preliminary determinations were its only cause.
Why did Thailand gain the most?
Thailand is outside the scope of the molded fiber tableware orders, which name China and Vietnam. Thailand faces a separate antidumping duty order on paper plates, which covers a different product scope. There is no countervailing duty order on paper plates from Thailand; that proceeding named China and Vietnam only.
Thailand’s share rose from 0.7 percent in January 2025 to a peak of 54.7 percent in January 2026, and has since ranged between 44.4 and 47.4 percent.
Vietnam is named in the molded fiber orders but was not displaced, holding between 8.1 and 19.2 percent throughout. Antidumping rates are set per exporter rather than per country, which may explain why some Vietnamese shipments continued.
Has India’s share increased?
India’s share rose from 0.9 percent in January 2025 to 5.8 percent in July 2026, a 6.4-fold increase. India was the seventh largest origin in May 2026, behind Thailand, Vietnam, Indonesia, Taiwan, the Dominican Republic and Malaysia. By July 2026 it had risen to fourth, behind Thailand, Vietnam and Malaysia only, its highest placing in the series.
India’s share is volatile. It peaked at 11.9 percent in July 2025 and 11.5 percent in August 2025, then fell to 0.9 percent by December 2025 before recovering. Monthly values at this scale are sensitive to individual container shipments, so short term movements should not be read as trend.
What importers should check
The figures above describe the market. Four things follow from them for anyone placing an order.
Check the origin on your last invoice, not the brand on the box. Duties attach to country of manufacture and to the specific exporter, not to the trading company that sold to you. A supplier can change its manufacturing origin without changing its name.
Ask for the exporter’s own rate, not the country rate. Antidumping rates are set per exporter. Two factories in the same country can carry very different rates, and the country-wide rate applies only where an exporter has no rate of its own.
Expect Thailand in competing quotes. Thailand supplies 44.4 percent of this market and is outside the molded fiber orders. If a quote looks unusually competitive, origin is the first thing to check, along with whether the product falls under the separate paper-plates orders that do cover Thailand.
Price the paperwork, not just the unit. The cost difference between origins now sits in duty exposure, cash deposits at entry and the documentation needed to prove scope. Those are landed-cost items that do not appear on a unit price.
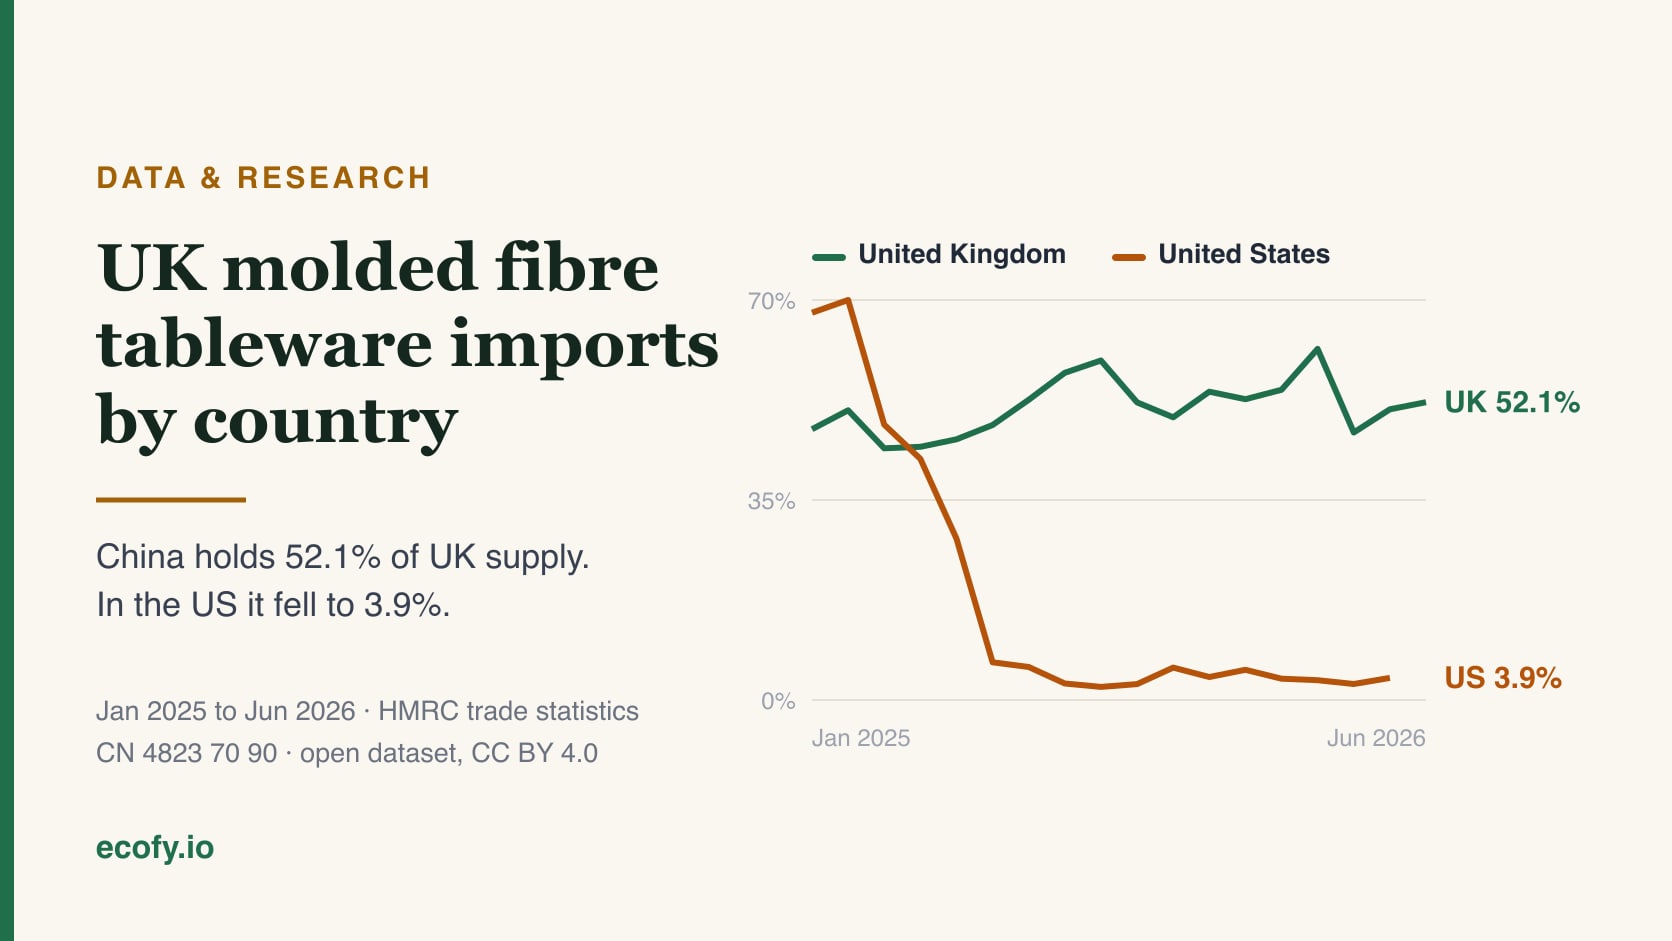
Do not apply this to your UK buying. The pattern on this page is specific to the US market. China still supplied 51.7 percent of UK moulded pulp tableware imports between January 2025 and June 2026, and its UK share rose over the period rather than falling, because the UK has no equivalent duty order. If you supply both markets they warrant separate sourcing decisions. See our UK molded fibre tableware import study.
Methodology
Source. US Census Bureau, USA Trade Online / international trade API, general imports. Retrieved 6 October 2026.
Which commodity code this uses
Commodity code. HS 4823.70.0020 in the Harmonized Tariff Schedule of the United States (HTSUS), described there as “plates, bowls or cups of paper pulp”. This is the specific US ten digit line for molded fiber tableware. The duty orders use the term “thermoformed molded fiber products”, which covers these goods among others: the scope also reaches the residual 4823.70.0040 line and several 4823.61 and 4823.69 subheadings.
Why the ten digit code matters
Why the ten digit code matters. The six digit heading 4823.70 also contains 4823.70.0040, the residual “Other” line under “molded or pressed articles of paper pulp”, which includes egg cartons and protective packaging. Analysis at six digit level materially misstates the tableware picture, and understates India in particular. Figures on this page use the tableware line only.
How the figures were reconciled
Aggregates excluded. The Census country dimension returns trade blocs such as ASEAN and APEC and continent level codes alongside individual countries. These are excluded, leaving 37 individual countries and territories. Before publication the sum of those country values was checked against the Census TOTAL FOR ALL COUNTRIES row for each month and matched. The published CSV contains the country rows only, so a reader reproducing this should pull the total row directly from Census.
Values. General imports, in US dollars. General imports measure everything arriving in the country, including goods entering bonded warehouses and foreign trade zones. Census also publishes imports for consumption, which counts goods entering the domestic economy and is the basis on which duty is assessed. The two series differ, so a figure quoted from one should not be compared with the other. Neither is customs value, and neither includes duty paid.
Revision history
6 October 2026. Extended the series from 17 months to 19, adding June and July 2026 from the US Census Bureau. Both new months reconcile to the Census total for all countries at 0.00 percent. Both charts were regenerated from the CSV rather than edited, so the plotted values cannot drift from the data. No previously published figure changed. Three findings moved: Thailand reached 56.9 percent in July 2026, its highest share in the series; India rose to 5.8 percent and fourth place, its highest placing, from seventh in May 2026; and the fall in total monthly import value since January 2025 is now 45 percent rather than 41. The previous note that June 2026 had published but was not yet reflected here is resolved by this update. The stated publication lag was corrected from six to seven weeks to approximately two months, on the evidence that July 2026 was available and August 2026 was not at the retrieval date.
20 August 2026. Six corrections, none of which changes a figure, a share, a ranking or the page’s conclusions.
The page previously said the fall in Chinese share happened “roughly seven months before the duty orders took legal effect” and attributed it to importers acting on the preliminary determinations. The dates of those determinations are now named, Commerce published its preliminary countervailing duty determination on 14 March 2025 and its preliminary antidumping determination on 12 May 2025, and the causal claim has been withdrawn to what the data actually supports. These are arrival figures, so a month’s imports were produced and shipped weeks earlier and cannot respond to a notice published inside that month, and the same months carried a broad escalation of US tariffs on Chinese goods that this series cannot separate from the molded fiber proceeding.
Corrected: the statement that no origin inside “Other” exceeded 3 percent in any month, Mexico reached 3.8 percent in February 2026. Corrected: Thailand faces an antidumping duty order on paper plates, not antidumping and countervailing, the countervailing proceeding named China and Vietnam only. Corrected: 4823.70.0040 was quoted as “molded or pressed articles of paper pulp, not elsewhere specified”, which is not its tariff wording, it is the residual “Other” line. Corrected: the duty order scope was described as covering “the same goods” as this tariff line when it is broader. Corrected: the stated publication lag of two to three months, the actual lag is about six to seven weeks.
The Census series was re-verified against the international trade API on 20 August 2026 and no revisions were found, so the retrieval date of 4 August 2026 stands and every figure on the page is unchanged. China at 67.8 percent in January 2025 falling to 3.9 percent in May 2026, Thailand at 0.7 percent rising to 44.4 percent, the Thailand over China crossover in June 2025 and India at 4.8 percent in May 2026 all reproduce exactly, as does every cell of the data table. Anyone who has cited this page can continue to rely on those figures. Note that June 2026 has since published and is not yet included here; it will be picked up at the next quarterly revision.
Limitations
- Trade codes are not brands. A country’s share indicates nothing about which manufacturer within that country won the business.
- Values, not volumes. A shift in reported value can reflect price as well as quantity.
- Data revises. Census figures are subject to revision. All figures carry a retrieval date.
- Publication lag. July 2026 was the most recent month available at the retrieval date of 6 October 2026, and August 2026 had not yet published at that date. On that evidence the lag runs approximately two months after month end.
- Mirror data disagrees. India’s own export statistics report a materially larger value shipped to the United States than US figures record arriving. This page uses US reported data throughout, so shares are internally consistent, but the discrepancy is unresolved and relevant to anyone comparing sources.
Reuse and citation
Next update: this dataset is refreshed quarterly. The next revision is due November 2026, covering data to approximately August 2026.
The underlying data is published by the US Census Bureau and is not subject to copyright. Our analysis, tables and charts may be republished with attribution to Ecofy and a link to this page.
Suggested citation: Ecofy, “US Molded Fiber Tableware Imports by Country (2025-2026)”, analysis of US Census Bureau data, retrieved 6 October 2026, ecofy.io/resources/data/us-molded-fiber-tableware-imports/
The full monthly dataset by country is available as an open CSV, with no registration required.
Sources
- US Census Bureau, foreign trade data
- Harmonized Tariff Schedule of the United States
- Federal Register: antidumping duty order, thermoformed molded fiber products from China and Vietnam (27 January 2026)
- Federal Register: countervailing duty order, same products and origins (27 January 2026)
For the rules behind these figures, including which origins pay duty and how rates are set per exporter, see our guide to the 2026 US duty orders on molded fiber tableware. Buyers evaluating Indian supply can review sourcing for the US market.
Open dataset
Full monthly figures by country. No registration required. Source: US Census Bureau, covering 2025-01 to 2026-05, retrieved 2026-08-04.
Download CSVWant guides like this in your Google results?
Add Ecofy as a preferred source. Google will surface our compliance standards and trade-data guides more often when you search packaging rules, including in AI Overviews. Takes one click and you can remove it any time.