UK Molded Fibre Tableware Imports by Country (2025-2026)
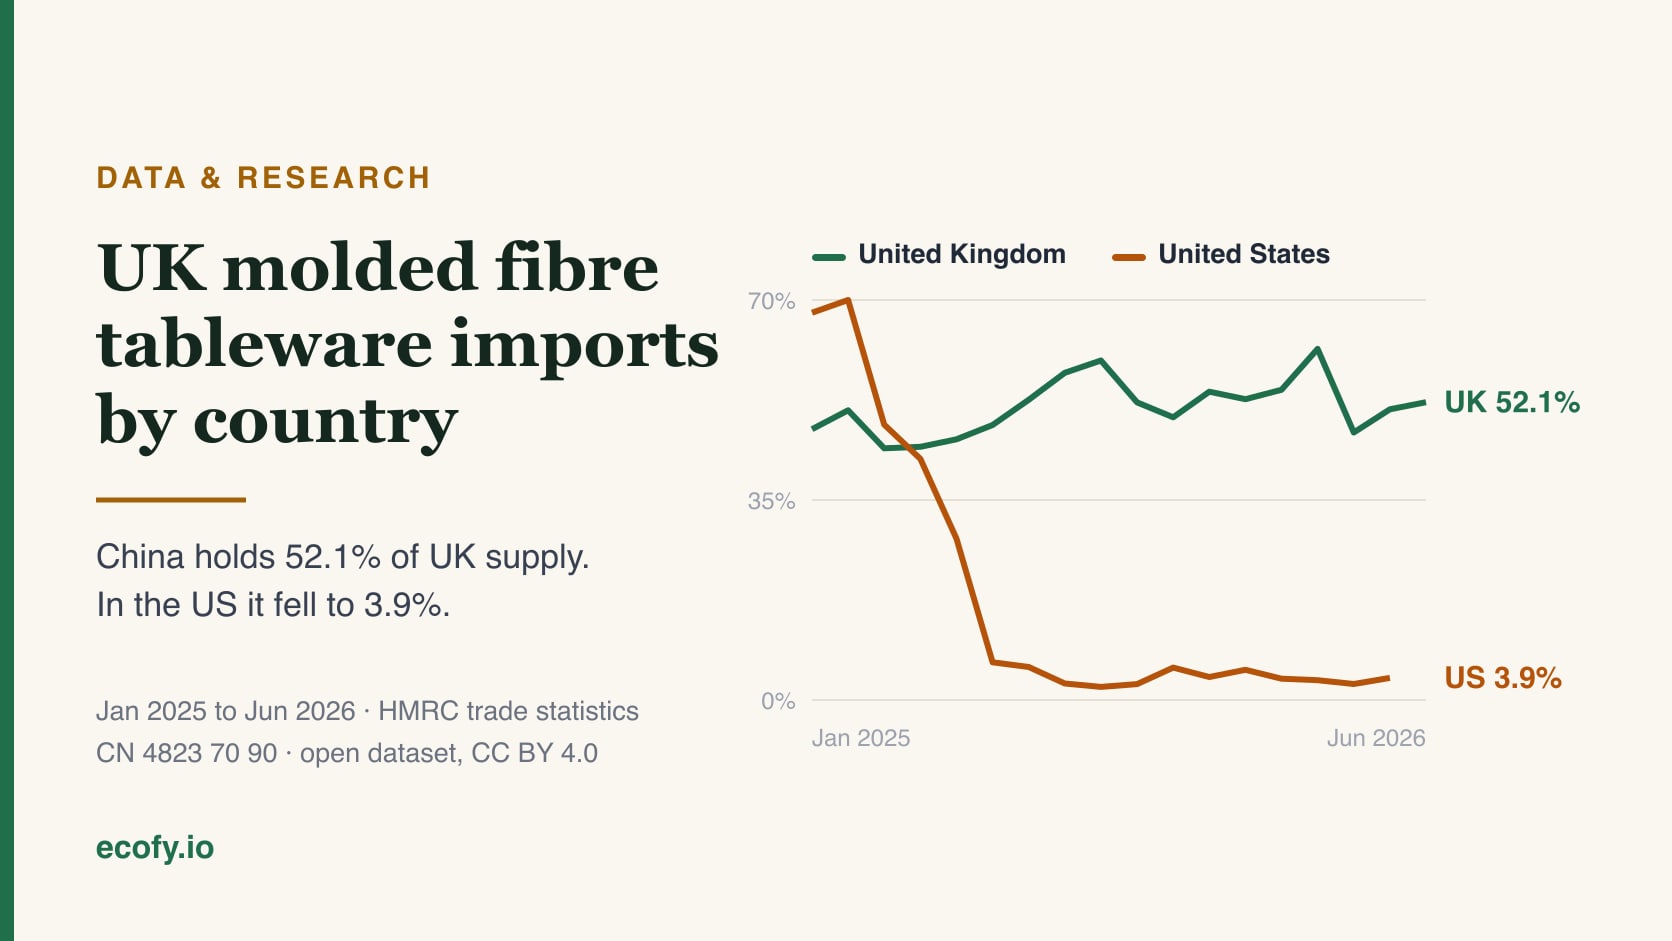
Monthly UK import data for moulded pulp and paper tableware by origin. China holds 51.6%, unlike the US where it fell to 4.3%. HMRC figures, open dataset.
On this page
Sourcing in bulk?
Tell us your products and quantity
We supply distributors and brands in 30+ countries, and reply with pricing, lead time and shipping.
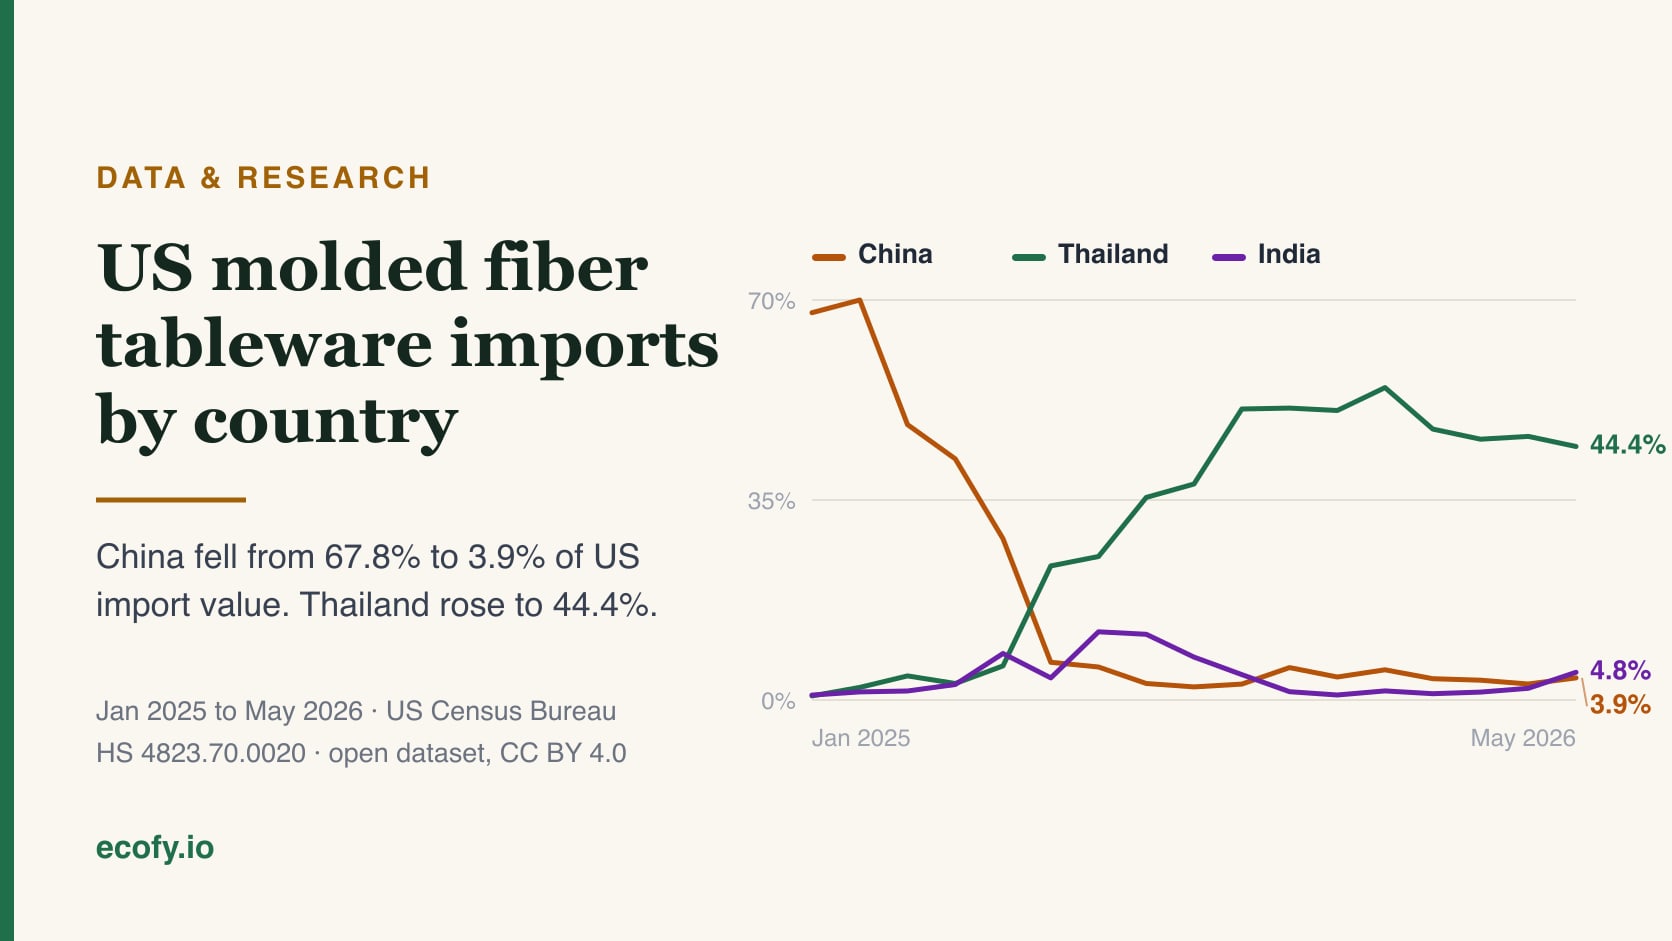
Key finding: China supplied 52.1 percent of UK moulded pulp tableware imports from January 2025 to July 2026, and its monthly share moved from 47.4 percent to 50.6 percent, holding above 40 percent in every month of the series. Across January 2025 to May 2026, China’s share of US molded fiber tableware imports fell from 67.8 percent to 3.9 percent. The shift that reshaped US sourcing has not reached the UK.
51.6%
China's share
was 47.4% in Jan 2025
3.9%
China's US share
HTS 4823.70.0020, May 2026
5.1%
India's share
4th largest of 41 origins
£64.85m
Total, 18 months
CN 4823 70 90
Why does China still hold half the UK market?
The UK has no antidumping or countervailing duty order on moulded fibre tableware. The United States does. US orders on imports from China took legal effect on 27 January 2026, and US buyers began moving on the preliminary determinations from around March 2025. UK buyers faced no equivalent cost shock, so the commercial reason to re-source did not arise.
China’s share of UK moulded pulp tableware imports moved between 44.1 percent in March 2025 and 61.4 percent in March 2026. There is no month in the series where it approaches the collapse visible in the US data.
Which countries supply UK moulded pulp tableware?
China supplied 51.6 percent by value between January 2025 and July 2026. Germany followed at 7.3 percent, Spain at 6.2 percent, India at 5.2 percent and Czechia at 4.6 percent. Total imports on this line were 64.85 million pounds from 42 partner countries.
| Rank | Origin | Value (GBP m) | Share |
|---|---|---|---|
| 1 | China | 33.47 | 51.6% |
| 2 | Germany | 4.77 | 7.3% |
| 3 | Spain | 3.99 | 6.2% |
| 4 | India | 3.37 | 5.2% |
| 5 | Czechia | 2.97 | 4.6% |
| 6 | France | 2.57 | 4.0% |
| 7 | Belgium | 2.07 | 3.2% |
| 8 | Italy | 1.89 | 2.9% |
| 9 | Netherlands | 1.52 | 2.3% |
| 10 | Turkey | 1.31 | 2.0% |
Commodity 4823 70 90, moulded or pressed articles of paper pulp not elsewhere specified. January 2025 to July 2026.
Which countries supply UK paper tableware?
The parallel line, 4823 69 10 for trays, dishes and plates of paper or paperboard, totalled 53.88 million pounds from 40 partners. China supplied 52.6 percent. Sweden was second at 14.2 percent and Finland third at 5.9 percent. That Nordic presence is worth reading carefully: Sweden and Finland are integrated pulp and board producers, so their share on this line reflects converted paper and board tableware rather than moulded fibre pressed from agricultural residue. A buyer comparing quotes across this code is often comparing two different manufacturing routes, not two prices for the same product. India supplied 3.15 percent and was sixth.
| Rank | Origin | Value (GBP m) | Share |
|---|---|---|---|
| 1 | China | 28.34 | 52.6% |
| 2 | Sweden | 7.64 | 14.2% |
| 3 | Finland | 3.17 | 5.9% |
| 4 | Greece | 2.61 | 4.8% |
| 5 | Netherlands | 2.17 | 4.0% |
| 6 | India | 1.70 | 3.2% |
| 7 | Poland | 1.67 | 3.1% |
| 8 | Spain | 1.56 | 2.9% |
| 9 | UAE | 1.10 | 2.0% |
| 10 | Turkey | 0.99 | 1.8% |
Month by month, is the UK trend moving at all?
No. Monthly import value on commodity 4823 70 90 ranged between 2.81 million pounds in June 2025 and 4.56 million pounds in October 2025. China’s monthly share ranged from a low of 44.1 percent in March 2025 to a high of 61.4 percent in March 2026. India’s monthly share ranged between 2.7 percent and 9.4 percent.
| Month | Total (GBP m) | China | India |
|---|---|---|---|
| 2025-01 | 2.88 | 47.4% | 5.1% |
| 2025-02 | 3.15 | 50.7% | 5.4% |
| 2025-03 | 3.25 | 44.1% | 9.4% |
| 2025-04 | 2.90 | 44.3% | 5.0% |
| 2025-05 | 2.89 | 45.6% | 7.3% |
| 2025-06 | 2.81 | 48.1% | 2.9% |
| 2025-07 | 3.60 | 52.5% | 2.8% |
| 2025-08 | 3.36 | 57.3% | 8.5% |
| 2025-09 | 4.06 | 59.4% | 2.9% |
| 2025-10 | 4.56 | 52.1% | 5.4% |
| 2025-11 | 3.32 | 49.5% | 2.9% |
| 2025-12 | 3.55 | 54.0% | 4.9% |
| 2026-01 | 2.84 | 52.6% | 6.3% |
| 2026-02 | 3.15 | 54.3% | 5.3% |
| 2026-03 | 4.08 | 61.4% | 4.0% |
| 2026-04 | 3.42 | 46.7% | 4.0% |
| 2026-05 | 3.94 | 50.9% | 2.7% |
| 2026-06 | 3.81 | 52.1% | 7.9% |
| 2026-07 | 3.29 | 50.6% | 7.0% |
What would have to change for UK sourcing to shift?
Three mechanisms could move this market, and none of them is currently active.
A trade remedy case. The US shift was caused by duty, not preference. The UK equivalent would be an investigation by the Trade Remedies Authority, which acts on an application from UK industry rather than on its own initiative. The UK does use this instrument on tableware, with anti-dumping measures applying to ceramic tableware and kitchenware from China. We found no measure covering moulded fibre tableware on the TRA public register as at 6 October 2026. Absent a UK producer lodging an application, there is no obvious route to one.
Packaging EPR fee differentials. UK Extended Producer Responsibility fees are charged per tonne by material category, and fibre-based composites carry a materially higher fee than plain paper or board. Fee changes alter the economics of coated versus uncoated fibre, which affects product specification more than it affects country of origin.
Freight economics. Moulded fibre is bulky and light, so freight is a large share of landed cost. Container rates and transit times from Asia to UK ports move the origin decision more than small unit-price differences do.
What this means if you are buying
If you buy foodservice packaging into the UK, three things follow from this data.
Your competitors are mostly still buying Chinese. Just over half of UK supply on both lines comes from China. A UK distributor sourcing from India or elsewhere is currently in a minority, which cuts both ways: less crowded, but also less established with UK customers.
UK exposure is different from US exposure. A US buyer carries antidumping and countervailing duty risk on Chinese moulded fibre. A UK buyer does not. If you supply both markets, they warrant separate sourcing decisions rather than one global policy. Our US import duty guide covers the US side, and the four molded fiber types explains which products these commodity codes capture.
The UK cost driver is regulatory, not tariff. The UK Plastic Packaging Tax charges 228.82 pounds per tonne on plastic packaging below 30 percent recycled content, and moulded bagasse fibre sits outside it entirely because it is not a plastic. That, rather than import duty, is what moves UK landed-cost comparisons. You can model it on the UK plastic tax calculator. See our UK Plastic Packaging Tax guide for how that applies to a mixed pallet. If this data prompts you to look at Indian supply, our guide to importing bagasse tableware from India covers the documentation and customs side.
Methodology
Figures are UK import values in pounds sterling from HMRC (HM Revenue and Customs) Overseas Trade Statistics, or OTS, retrieved from the uktradeinfo OData API on 6 October 2026. Imports are the sum of FlowTypeId 1, EU Imports, and FlowTypeId 3, Non-EU Imports.
Two commodity lines are reported separately:
- 4823 70 90, moulded or pressed articles of paper pulp, n.e.s.
- 4823 69 10, trays, dishes and plates, of paper or paperboard, excluding bamboo
Egg packaging, 4823 70 10, is excluded. It is a larger line than the tableware one, at 48.55 million pounds in calendar 2025 against 40.32 million pounds for 4823 70 90, so including it would swamp the tableware signal. This is the same trap that six-digit analysis creates.
Every country was aggregated from the full result set and then ranked, rather than tracking a pre-chosen list. The HMRC API returns 1000 rows and no continuation link even when more rows exist, so each query was counted first and then paged with explicit offsets until the fetched row count equalled the reported count. All 2,188 rows reconcile.
US comparison figures are from the US Census Bureau on HS 4823.70.0020 and are reproduced from our US molded fiber tableware imports study.
Limitations
No UK code isolates moulded fibre foodservice tableware. The US HTS (Harmonized Tariff Schedule) line 4823.70.0020 covers plates, bowls or cups of paper pulp specifically. The UK CN (Combined Nomenclature) has no such line. Bagasse tableware may be declared under either 4823 70 90 or 4823 69 10 depending on the declarant, so neither figure alone is a complete measure and the two should not be added together as if they were mutually exclusive product sets.
Both lines include non-foodservice goods. 4823 70 90 is a residual category that captures moulded pulp articles other than egg packaging, including industrial protective packaging. Share movements should be read as directional.
Cross-check. The two eight-digit lines under 4823 70 sum to 88.87 million pounds for calendar 2025, against 117.47 million US dollars reported by UN Comtrade for the UK on the six-digit HS (Harmonised System) heading 482370 in the same year, a 97 percent match at an approximate exchange rate. The residual is exchange rate treatment and revision timing.
Values are customs values, not retail or landed cost, and monthly trade data is revised.
Reuse and citation
This page and its dataset are open. The underlying figures are published by HMRC under the Open Government Licence v3.0, which permits commercial reuse with attribution. Contains public sector information licensed under the Open Government Licence v3.0. No confidentiality-suppressed rows are reproduced. Our analysis, charts and tables may be republished with attribution to Ecofy and a link to this page, under CC BY 4.0.
Suggested citation:
Ecofy (2026). UK Molded Fibre Tableware Imports by Country, 2025-2026. Retrieved 6 October 2026 from https://ecofy.io/resources/data/uk-molded-fibre-tableware-imports/
Sources
- HMRC Overseas Trade Statistics, uktradeinfo, the UK customs trade data service
- UK Integrated Online Tariff, heading 4823.70, for commodity code descriptions
- US Census Bureau foreign trade data, for the US comparison series
- UN Comtrade, used as an independent cross-check
Revision history
8 October 2026. HMRC revised April 2026 between the August and October pulls. The April row is corrected from 3.41 to 3.42 million pounds and China’s share from 46.8 to 46.7 percent. No other month changed and no whole-period figure moved. Found by re-verifying every published table row against the refreshed source rather than only checking the months being added, which is the check the 6 October update should have included.
6 October 2026. Extended from 17 months to 19, adding June and July 2026 from HMRC uktradeinfo. Both commodity codes reconciled against the API row count (48236910: 1045 of 1045; 48237090: 1258 of 1258), per the known silent-truncation trap where $top=1000 returns no nextLink. The UK-vs-US chart was regenerated from both CSVs rather than edited. China’s whole-period share on 4823 70 90 is 51.6 percent across 64.85 million pounds and 42 partner countries, revised from 51.7 percent across 61.55 million and 41 countries as the series lengthened; its monthly share stands at 50.6 percent in July 2026. India is 5.2 percent and fourth. The TRA public register was re-checked on this date and still lists no moulded fibre case, only ceramic tableware.
Also fixed a generator bug: the chart’s month labels were hardcoded while its values interpolated from the data, so the title read “June 2026” against a July figure. Labels now derive from the data.
Open dataset
Full monthly figures by country. No registration required. Source: HMRC Overseas Trade Statistics (uktradeinfo), covering 2025-01 to 2026-06, retrieved 2026-08-26.
Download CSVWant guides like this in your Google results?
Add Ecofy as a preferred source. Google will surface our compliance standards and trade-data guides more often when you search packaging rules, including in AI Overviews. Takes one click and you can remove it any time.